---
title: heormodel
pagetitle: "heormodel: cost-effectiveness modeling and value of information in Python"
description: "heormodel is a Python package for cost-effectiveness modeling and value-of-information analysis: sample parameters, run a model, and report cost-effectiveness, sensitivity, and calibration results."
keywords:
- cost-effectiveness modeling
- cost-effectiveness analysis
- value of information
- probabilistic sensitivity analysis
- health economics
- health technology assessment
- cohort state-transition model
- microsimulation
- discrete-event simulation
- Bayesian calibration
- Python
title-block-banner: true
sidebar: false
---
heormodel builds cost-effectiveness models in Python and evaluates them under uncertainty. It samples parameters from distributions, runs a cohort state-transition, microsimulation, discrete-event, or compartmental model over those draws, and reports incremental cost-effectiveness ratios, cost-effectiveness acceptability curves, deterministic sensitivity analyses, and the expected value of perfect, partial perfect, and sample information. Bayesian calibration fits model parameters to data and carries the fitted uncertainty into the same analysis.
## Install
```bash
pip install heormodel
```
The `calibration` extra adds Bayesian calibration: `pip install "heormodel[calibration]"`.
## Quickstart
<!-- colab-badge:start -->
<a href="https://colab.research.google.com/github/pedroliman/heormodel/blob/main/docs/_notebooks/index.ipynb"><img src="https://colab.research.google.com/assets/colab-badge.svg" alt="Open In Colab"></a>
<!-- colab-badge:end -->
This example builds a three-state Markov cohort state-transition model that compares standard care with two treatments of different efficacy and cost. It then evaluates the model by probabilistic sensitivity analysis. Click **Open in Colab** above (or on any tutorial page) to run it in Google Colab, a browser-based notebook that needs no local installation:
```{python}
import matplotlib.pyplot as plt
import numpy as np
import pandas as pd
from heormodel.models import CohortSpec, MarkovModel
from heormodel.params import Beta, Gamma, ParameterSet
from heormodel.run import SeedManager, run_psa
from heormodel.cea import ceac, ceaf, icer_table
from heormodel.report import plot_ce_plane, plot_ceac
from heormodel.voi import evpi

WTP = 50_000.0


def model(p, intervention):
    rr = {"Standard care": 1.0, "Treatment A": p["rr_a"], "Treatment B": p["rr_b"]}[intervention]
    add_cost = {"Standard care": 0.0, "Treatment A": p["c_a"], "Treatment B": p["c_b"]}[intervention]
    p_progress = p["p_progress"] * rr
    # Transition matrix. Rows: current state. Columns: next state.
    P = np.array([
        [1 - p_progress - p["p_die"], p_progress, p["p_die"]],
        [0.0, 1 - p["p_die_sick"], p["p_die_sick"]],
        [0.0, 0.0, 1.0],
    ])
    cost = np.array([0.0, p["c_sick"], 0.0])
    cost[:2] += add_cost
    return CohortSpec(P, cost, np.array([1.0, p["u_sick"], 0.0]))


engine = MarkovModel(states=("Healthy", "Sick", "Dead"),
                     interventions=("Standard care", "Treatment A", "Treatment B"),
                     transitions_and_rewards=model, n_cycles=40)

params = ParameterSet({
    "p_progress": Beta(20, 180), "rr_a": Beta(75, 25), "rr_b": Beta(45, 55),
    "p_die": Beta(5, 995), "p_die_sick": Beta(50, 450),
    "c_sick": Gamma(100, 250.0), "c_a": Gamma(100, 20.0), "c_b": Gamma(100, 110.0),
    "u_sick": Beta(150, 50),
})

draws = params.sample(2_000, seed=SeedManager(1).generator())
outcomes = run_psa(engine, draws).outcomes
icer_table(outcomes).round(1)
```
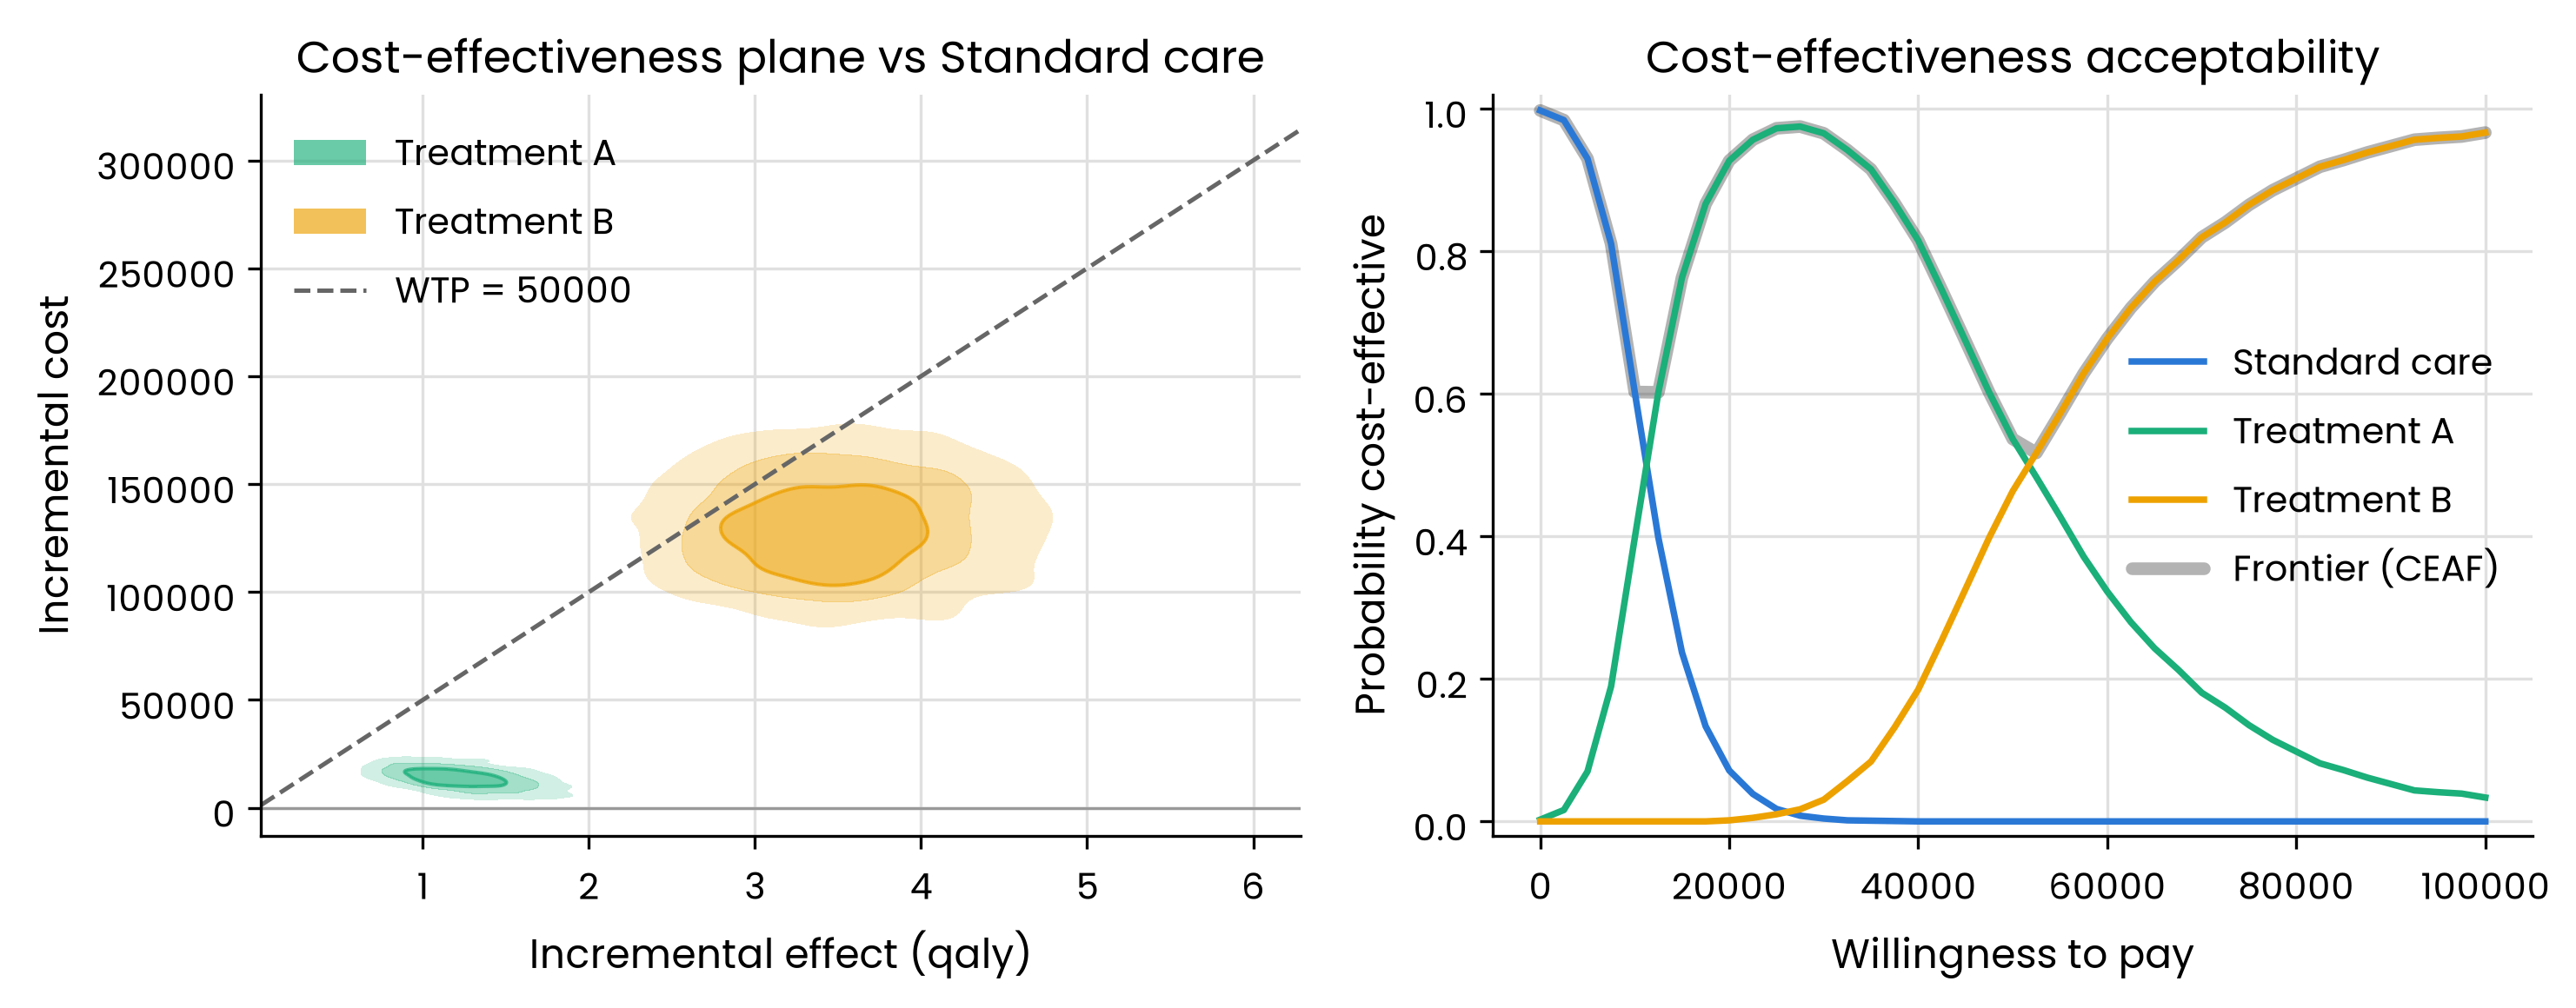
The `icer_table` orders interventions by cost and reports incremental cost-effectiveness ratios along the efficiency frontier. Its `status` column flags dominated (`D`) and extended-dominated (`ED`) interventions. Here all three interventions lie on the frontier: Treatment A enters near 11,000 per quality-adjusted life-year (QALY) and Treatment B near 52,000. `plot_ce_plane` summarizes each intervention's incremental cost and effect against standard care, across iterations, as nested 50%, 80%, and 95% highest-density regions. `plot_ceac` reports the share of iterations in which each intervention has the highest net benefit, across a grid of willingness-to-pay thresholds:
```{python}
grid = np.linspace(0, 100_000, 41)
ceac_df = ceac(outcomes, grid)
ceaf_df = ceaf(outcomes, grid)

fig, axes = plt.subplots(1, 2, figsize=(10, 4))
plot_ce_plane(outcomes, comparator="Standard care", wtp=WTP, ax=axes[0])
plot_ceac(ceac_df, ceaf_df=ceaf_df, ax=axes[1])
fig.tight_layout()
```
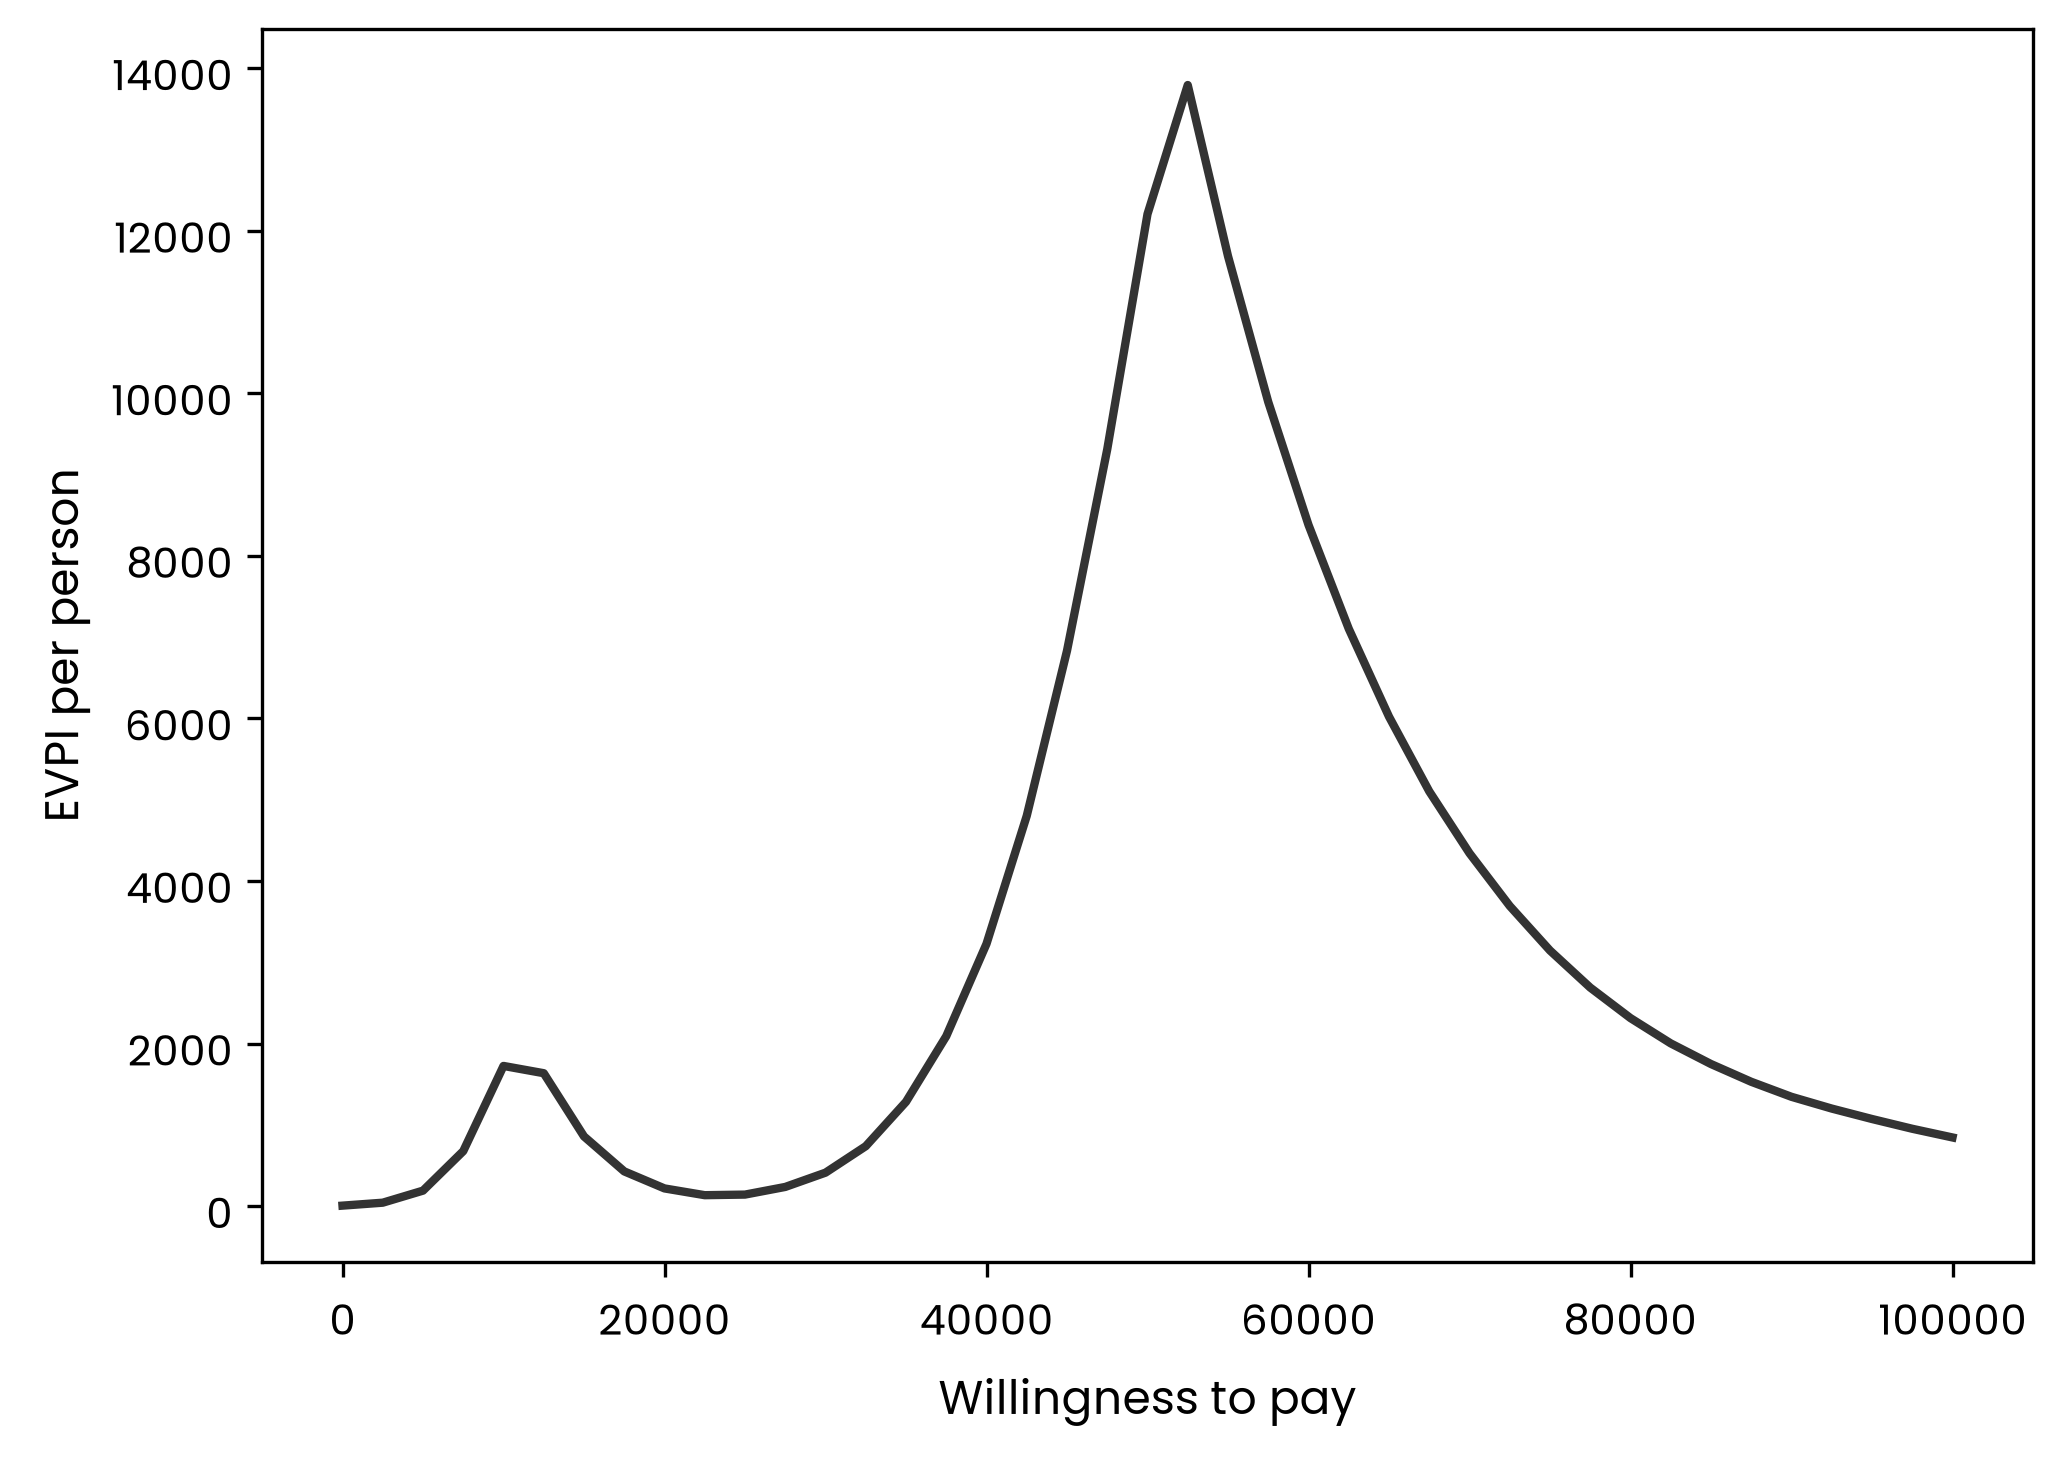
The acceptability curves cross near a willingness-to-pay threshold of 50,000. The choice between Treatment A and Treatment B is close there, so the expected value of perfect information (EVPI) is high. Across thresholds, EVPI peaks near each ICER on the frontier, and the peak is sharpest where the decision is closest:
```{python}
evpi_curve = evpi(outcomes, grid)
print(f"EVPI at WTP {WTP:,.0f}: {evpi(outcomes, WTP):,.1f}")

fig2, ax2 = plt.subplots()
ax2.plot(grid, evpi_curve.to_numpy(), color="#333333", lw=2)
ax2.set_xlabel("Willingness to pay")
ax2.set_ylabel("EVPI per person")
fig2.tight_layout()
```
## Where to go next
::: {.grid}
::: {.g-col-12 .g-col-md-4 .card .p-3}
#### [Browse the tutorials](tutorials/index.qmd)
Every tutorial, in the order a reader learns the package, from the standard workflow through the model engines to calibration.
:::
::: {.g-col-12 .g-col-md-4 .card .p-3}
#### [Full pipeline](tutorials/full-pipeline.qmd)
Parameters, `run_psa`, cost-effectiveness, and value of information end to end.
:::
::: {.g-col-12 .g-col-md-4 .card .p-3}
#### [Cohort state-transition model](tutorials/mdm-cohort.qmd)
The standard engine, validated against a published result, with the microsimulation engine as the detailed alternative.
:::
::: {.g-col-12 .g-col-md-4 .card .p-3}
#### [Compartmental transmission model](tutorials/seir-vaccination.qmd)
A susceptible-exposed-infectious-recovered vaccination model for infectious-disease cost-effectiveness analysis.
:::
::: {.g-col-12 .g-col-md-4 .card .p-3}
#### [Calibration workflow](tutorials/calibration-workflow.qmd)
Calibrate some parameters, take the rest from the literature, and mix them with `mix_draws`.
:::
::: {.g-col-12 .g-col-md-4 .card .p-3}
#### [API reference](reference/index.qmd)
Every public function, generated from docstrings.
:::
:::