import numpy as np
import pandas as pd
from heormodel.models import CohortSpec, MarkovModel

STATES = ("H", "S1", "S2", "D")
INTERVENTIONS = ("Standard of care", "Intervention A", "Intervention B", "Intervention AB")

def r2p(rate):
    return 1.0 - np.exp(-np.asarray(rate))

def model(p, intervention):
    p_HS1, p_S1H, p_S1S2 = r2p(p["r_HS1"]), r2p(p["r_S1H"]), r2p(p["r_S1S2"])
    p_HD, p_S1D, p_S2D = r2p(p["r_HD"]), r2p(p["r_HD"] * p["hr_S1"]), r2p(p["r_HD"] * p["hr_S2"])
    prog = r2p(p["r_S1S2"] * p["hr_S1S2_trtB"]) if "B" in intervention else p_S1S2
    P = np.zeros((4, 4))
    P[0, 0], P[0, 1], P[0, 3] = (1 - p_HD) * (1 - p_HS1), (1 - p_HD) * p_HS1, p_HD
    P[1, 0], P[1, 2], P[1, 3] = (1 - p_S1D) * p_S1H, (1 - p_S1D) * prog, p_S1D
    P[1, 1] = (1 - p_S1D) * (1 - p_S1H - prog)
    P[2, 2], P[2, 3], P[3, 3] = 1 - p_S2D, p_S2D, 1.0
    add = {"Standard of care": 0.0, "Intervention A": p["c_trtA"],
           "Intervention B": p["c_trtB"], "Intervention AB": p["c_trtA"] + p["c_trtB"]}[intervention]
    cost = np.array([p["c_H"], p["c_S1"] + add, p["c_S2"] + add, 0.0])
    u_s1 = p["u_trtA"] if intervention in ("Intervention A", "Intervention AB") else p["u_S1"]
    return CohortSpec(P, cost, np.array([p["u_H"], u_s1, p["u_S2"], 0.0]))

engine = MarkovModel(states=STATES, interventions=INTERVENTIONS, transitions_and_rewards=model,
                     n_cycles=75, initial_state="H", cycle_correction="simpson")

base = pd.Series(dict(
    r_HD=0.002, r_HS1=0.15, r_S1H=0.5, r_S1S2=0.105, hr_S1=3.0, hr_S2=10.0,
    hr_S1S2_trtB=0.6, c_H=2000.0, c_S1=4000.0, c_S2=15000.0, c_trtA=12000.0,
    c_trtB=13000.0, u_H=1.0, u_S1=0.75, u_S2=0.5, u_trtA=0.95))
WTP = 100_000.0Deterministic sensitivity analysis
Run the three deterministic sensitivity designs, one-way, one-at-a-time, and grid, and read them as tornado and heatmap reports.
Keywords
deterministic sensitivity analysis, DSA, one-way sensitivity analysis, one-at-a-time, tornado diagram, tornado plot, scenario analysis, cost-effectiveness, Python

Probabilistic sensitivity analysis measures how uncertain a decision is. Deterministic sensitivity analysis (DSA) shows which parameters change the result, and by how much. This tutorial shows how to run the three standard DSA designs (one-way, one-at-a-time, and grid) on the Sick-Sicker cohort model that the cohort tutorial uses for its probabilistic analysis. The full script is examples/dsa.py.
heormodel.dsa builds scenario designs that run through run_psa like any draw matrix. A design has one row per scenario instead of one row per random draw, and it comes with a descriptor table naming what each scenario varied. The same cost-effectiveness functions then read the outcomes.
Specifying the model and base case
The model is the four-state Sick-Sicker cohort of the cohort tutorial. The base case is the point estimates from Table 1 of the source article (Alarid-Escudero and others, 2023), held in a pandas.Series indexed by parameter name. Every DSA builder takes this series as input.
Running a one-way sweep
one_way varies a single parameter across the listed values, holding the rest at base. Each design reports the incremental net monetary benefit of one intervention over its comparator, \(\text{INMB} = \lambda\,\Delta E - \Delta C\). It is positive exactly when the intervention is cost-effective at the threshold \(\lambda\). Here the incremental net monetary benefit of Intervention AB over standard of care falls as the treatment-B cost rises, crossing zero near its base value.
from heormodel.cea import nmb
from heormodel.dsa import one_way
from heormodel.run import run_psa

design, _ = one_way(base, "c_trtB", [8_000.0, 13_000.0, 18_000.0])
nb = nmb(run_psa(engine, design).outcomes, WTP)
(nb["Intervention AB"] - nb["Standard of care"]).round(0)
iteration
0 65162.0
1 15256.0
2 -34650.0
dtype: float64Building a one-at-a-time tornado
one_at_a_time sweeps each parameter between its low and high value in turn. The result is the set of one-way sweeps with the base case included once. tornado_data reads the (design, descriptor) pair directly, taking the net monetary benefit at each parameter’s low and high value. It returns the same table its probabilistic form does, so plot_tornado is unchanged.
from heormodel.dsa import one_at_a_time
from heormodel.report import plot_tornado, tornado_data

ranges = {name: (0.8 * base[name], 1.2 * base[name]) for name in base.index}
oat = one_at_a_time(base, ranges)
td = tornado_data(run_psa(engine, oat[0]).outcomes, oat, wtp=WTP,
                  intervention="Intervention AB", comparator="Standard of care")
plot_tornado(td.head(6))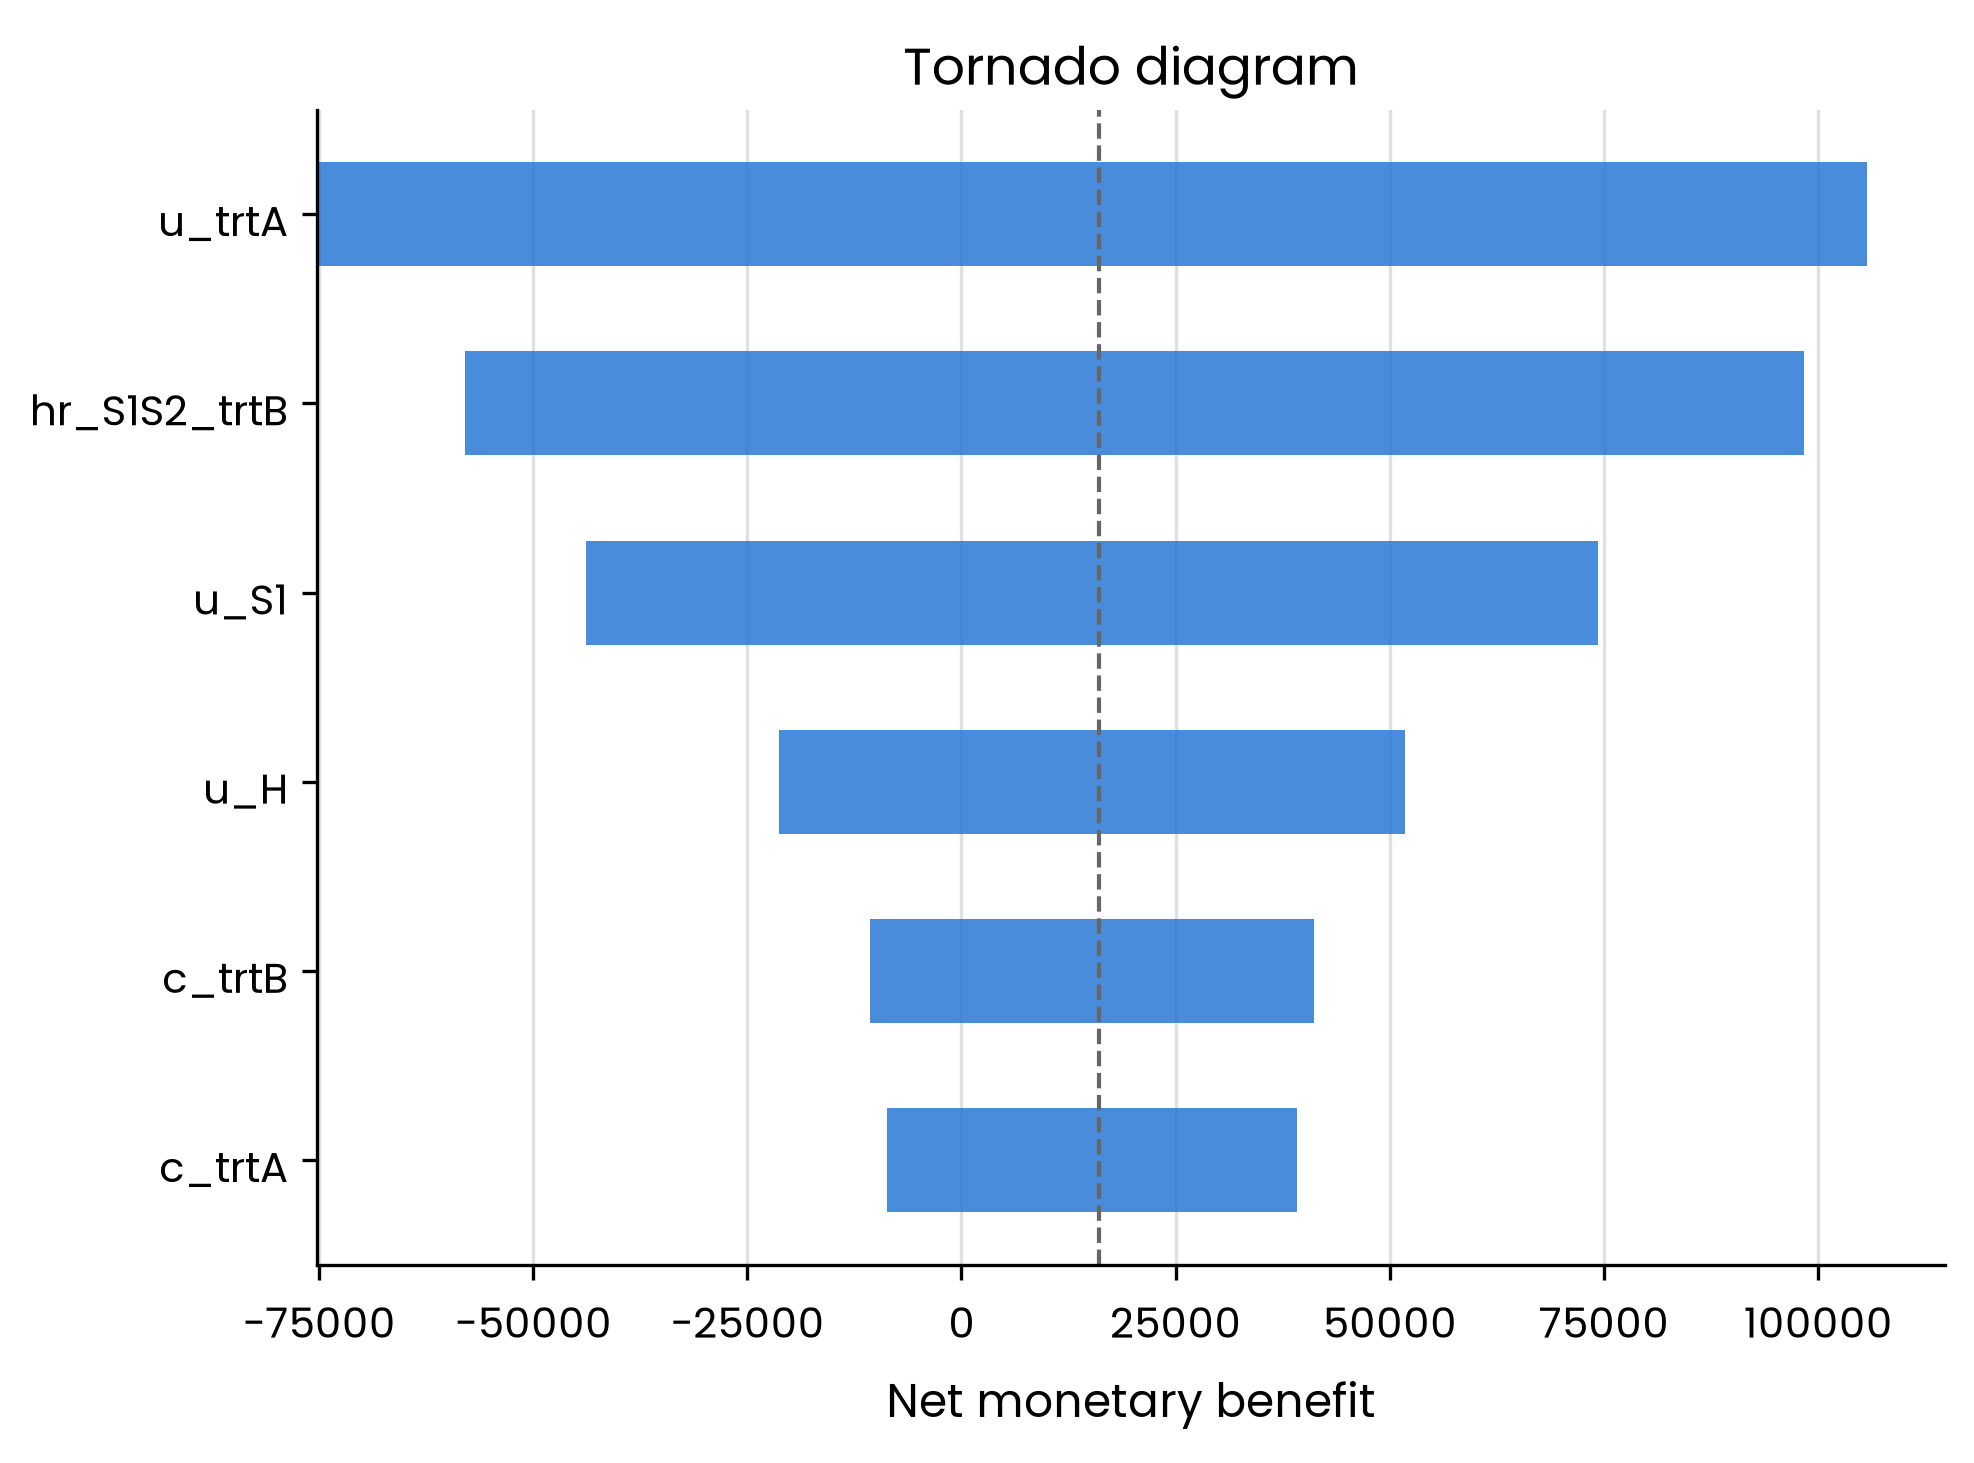
The utility of the treated Sick state (u_trtA) and the progression hazard ratio under treatment B (hr_S1S2_trtB) change the result most. The state costs change it least.
Sweeping a two-way grid
grid takes the full factorial of two or more parameters. heatmap_data reshapes a per-scenario outcome into a matrix over two of them. Here the incremental net monetary benefit of Intervention AB ranges from positive to negative across the two treatment costs.
from heormodel.dsa import grid
from heormodel.report import heatmap_data

gd, gdesc = grid(base, {"c_trtA": [6_000.0, 12_000.0, 18_000.0],
                        "c_trtB": [8_000.0, 13_000.0, 18_000.0]})
gnb = nmb(run_psa(engine, gd).outcomes, WTP)
heatmap_data(gnb["Intervention AB"] - gnb["Standard of care"], gdesc,
x="c_trtA", y="c_trtB").round(0)| c_trtA | 6000.0 | 12000.0 | 18000.0 |
|---|---|---|---|
| c_trtB | |||
| 8000.0 | 125049.0 | 65162.0 | 5275.0 |
| 13000.0 | 75143.0 | 15256.0 | -44631.0 |
| 18000.0 | 25237.0 | -34650.0 | -94538.0 |
The grid center reproduces the one-way sweep’s base value, since both hold the other parameters at base. The probabilistic analysis averages over the joint distribution of all parameters. The deterministic analysis instead holds everything else fixed and varies one or two parameters at a time.
Next: the replication gallery collects the published models these engines reproduce.
Keywords: deterministic sensitivity analysis, DSA, one-way sensitivity analysis, one-at-a-time, tornado diagram, tornado plot, scenario analysis, cost-effectiveness, Python